NCERT Solutions For Class 10 Maths Exercise 14.1 Statistics
NCERT Solutions For Class 10 Maths Exercise 14.1 Statistics has been brought to you by Future Study Point to help you in your homework, assignments, and forthcoming examination of class 10 CBSE board exam. NCERT Solutions For Class 10 Maths Exercise 14.1 Statistics is one of the greatest input study materials through which you can clear your concepts on Statistics of 10 class CBSE. All questions are solved by an expert in maths by a step-by-step method.
NCERT Solutions For Class 10 Maths Exercise 14.1 Statistics
Click for online shopping
Future Study Point.Deal: Cloths, Laptops, Computers, Mobiles, Shoes etc
Q1.A survey was conducted by a group of students as a part of their environmental awareness programm in which they collected the following data regarding the number of plants in 20 houses in a locality . Find the mean number of plants per house.
Which method did you use for finding the mean , and why ?
Ans.
| No. of Plants | Class Mark (xi) | No. of Houses (fi ) | fixi |
| 0 – 2 2 – 4 4 – 6 6 – 8 8 – 10 10 – 12 12 – 14
| 1 3 5 7 9 11 13
| 1 2 1 5 6 2 3 ∑fi = 20 | 1 6 5 35 54 22 39 ∑fixi= 162 |
We have
Hence mean number of the plants is 8.1
The direct method is proper to use here because the values of observations and their frequencies are small.
NCERT Solutions For Class 10 Maths Exercise 14.1 Statistics
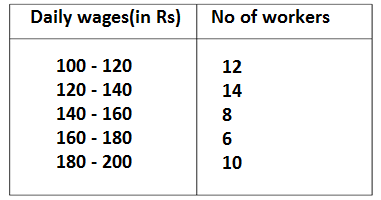
Q2.Consider the following distribution of daily wages of 50 workers of a factory. Find the mean daily wages of the workers of the factory by using an appropriate method.
Ans.
| Class Interval | Class Mark (xi) | Frequency(fi) | ui=(xi-A)/h | fixi |
| 100 – 120 | 110 | 12 | -2 | -24 |
| 120 – 140 | 130 | 14 | -1 | -14 |
| 140 – 160 | 150 = A | 8 | 0 | 0 |
| 160 – 180 | 170 | 6 | 1 | 6 |
| 180 – 200 | 190 | 10 | 2 | 20 |
| ∑fi = 50 | ∑fiui= -12 |
Since the class interval is of the size,h= 20 and sum of frequencies is 50, both of them are large therefore applying the step deviation method
Hence the mean daily wages of the workers of the factory is 145.20
NCERT Solutions For Class 10 Maths Exercise 14.1 Statistics
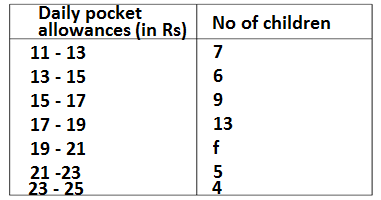
Q3. The following distribution shows the daily pocket allowance of children of a locality. The mean pocket allowance is Rs 18. Find the missing frequency f.
Ans.
| Daily pocket allowance (in Rs) | Class mark(xi) | Frequency(fi) | di= xi-A | fidi |
| 11 – 13 13 – 15 15 – 17 17 – 19 19 – 21 21 – 23 23 – 25 | 12 14 16 18 = A 20 22 24 | 7 6 9 13 f 5 4 | -6 -4 -2 0 2 4 6 | -42 -24 -18 0 2f 20 24 |
| ∑fi = 44 + f | ∑fidi= 2f – 40 |
Applying the shortcut method of mean
Where A = 18, ∑fidi= 2f – 40 , ∑fi = 44 + f and
2f – 40 = 0⇒ f = 20
Hence missing frequency is 20
NCERT Solutions For Class 10 Maths Exercise 14.1 Statistics
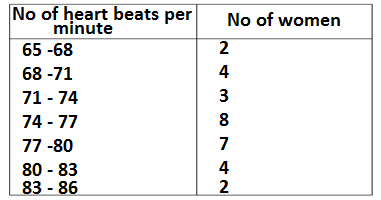
Q4.Thirty women were examined in a hospital by a doctor and the number of heartbeats per minute were recorded and summarized as follows. Find the mean heartbeats per minute for these women, choosing a suitable method.
Ans.
| No of heart beats per minute | Class mark(xi) | Frequency(fi) | fixi
|
| 65 – 68 | 66.5 | 2 | 133 |
| 68 – 71 | 69.5 | 4 | 278 |
| 71 – 74 | 72.5 | 3 | 217.5 |
| 74 – 77 | 75.5 | 8 | 604 |
| 77 – 80 | 78.5 | 7 | 549.5 |
| 80 – 83 | 81.5 | 4 | 326 |
| 83 – 86 | 84.5 | 2 | 169 |
| ∑fi= 30 | ∑fixi= 2277 |
Applying the direct method for getting the mean of the data
Hence mean of the heartbeats per minute of the women is 75.9
NCERT Solutions For Class 10 Maths Exercise 14.1 Statistics
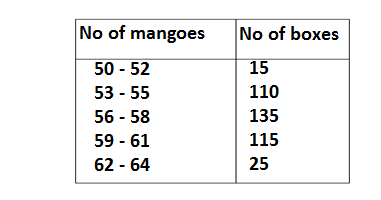
Q5. In a retail market ,fruit vendors were selling mangoes kept in packing boxes.These boxes contained varying number of mangoes .The following was the distribution of mangoes according to the number of boxes.
Find the mean number of the mangoes kept in a packing box. Which method of finding the mean did you choose.
Ans.
| No of mangoes | Class mark(xi) | Frequency (fi) | ui=(xi-A)/h | fiui |
| 50 – 52 53 – 55 56 – 58 59 – 61 62 – 64 | 51 54 57= A 60 63 | 15 110 135 115 25 | -2 -1 0 1 2 | -30 -110 0 115 50 |
| ∑fi= 400 | ∑fiui = 25 |
Here we have to apply step deviation because class intervals are not continuous
Hence the mean number of the mangoes kept in a packing box is 57.19
NCERT Solutions For Class 10 Maths Exercise 14.1 Statistics
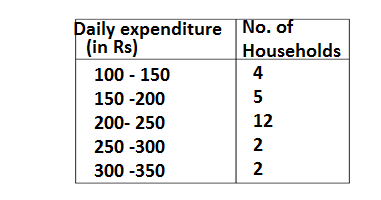
Q6.The table below shows the daily expenditure on food of 25 households in a locality.
Find the mean daily expenditure on food by suitable method.
Ans..
| Daily expenditure(in Rs) | Class marks(xi) | Frequency (fi) | ui= (xi -A)/h | fiui |
| 100 – 150 | 125 | 4 | -2 | -8 |
| 150 – 200 | 175 | 5 | -1 | -5 |
| 200 – 250 | 225 | 12 | 0 | 0 |
| 250 – 300 | 275 | 2 | 1 | 2 |
| 300 – 350 | 325 | 2 | 2 | 4 |
| ∑fi=25 | ∑fiui= -7 |
Hence the mean daily expenditure on food is 211
NCERT Solutions For Class 10 Maths Exercise 14.1 Statistics
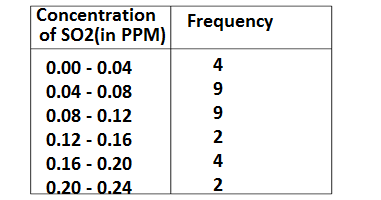
Q7. To find out the concentration of SO2 in the air (in parts per million,i.e PPM) ,the data was collected for 30 localities in a certain city and is presented below.
Ans.
| Concentration of SO2(PPM) | Class Mark(xi) | Frequency(fi) | ui=(xi -A)/h | fixi |
| o.oo – 0.04 | 0.02 | 4 | -2 | -8 |
| 0.04 – 0.08 | 0.06 | 9 | -1 | -9 |
| 0.08 – 0.12 | 0.10 | 9 | 0 | 0 |
| 0.12 – 0.16 | 0.14 | 2 | 1 | 2 |
| 0.16 – 0.20 | 0.18 | 4 | 2 | 8 |
| 0.20 – 0.24
| 0.22
| 2 ∑fi=30 | 3
| 6 ∑fiui=-1 |
Applying the step deviation method for getting the mean
Hence the average concentration of SO2 is 0.0987
NCERT Solutions For Class 10 Maths Exercise 14.1 Statistics
Q8. A class teacher has the following absentee record of 40 students of a class for the whole term. Find the mean number of days a student was absent.
Ans.
| No. of days | Class Mark(xi) | Frequency (fi) | fixi |
| 0 – 6 | 3 | 11 | 33 |
| 6 – 10 | 8 | 10 | 80 |
| 10 – 14 | 12 | 7 | 84 |
| 14 -20 | 17 | 4 | 68 |
| 20 – 28 | 24 | 4 | 96 |
| 28 – 38 | 33 | 3 | 99 |
| 38 – 40 | 39 | 1 | 39 |
| ∑fi= 40 | ∑fixi= 499 |
Applying direct method of getting the mean
=12 .48
The mean number of days a student was absent is 12.48
NCERT Solutions For Class 10 Maths Exercise 14.1 Statistics
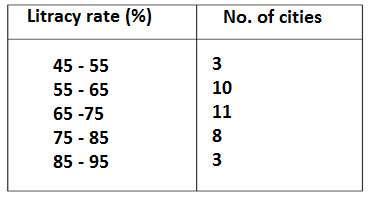
Q9.The following table gives the literacy rate (in percentage) of 35 cities. Find the mean literacy rate.
Ans.
| Litracy rate (%) | Class mark(xi) | Frequency(fi) | ui= (xi– A)/h | fixi |
| 45 – 55 | 50 | 3 | -2 | -6 |
| 55 – 65 | 60 | 10 | -1 | -10 |
| 65 – 75 | 70 = A | 11 | 0 | 0 |
| 75 – 85 | 80 | 8 | 1 | 8 |
| 85 – 95
| 90
| 3 ∑fi= 35 | 2
| 6 ∑fiui=-2 |
Applying the step deviation method
Where A = 70, h = 10
= 70 – 0.57 = 69.43 %
Hence the mean litracy rate is 69.43 %
You can compensate us by donating any amount of money for our survival
Our Paytm NO 9891436286
NCERT Solutions of Science and Maths for Class 9,10,11 and 12
NCERT Solutions of class 9 maths
| Chapter 1- Number System | Chapter 9-Areas of parallelogram and triangles |
| Chapter 2-Polynomial | Chapter 10-Circles |
| Chapter 3- Coordinate Geometry | Chapter 11-Construction |
| Chapter 4- Linear equations in two variables | Chapter 12-Heron’s Formula |
| Chapter 5- Introduction to Euclid’s Geometry | Chapter 13-Surface Areas and Volumes |
| Chapter 6-Lines and Angles | Chapter 14-Statistics |
| Chapter 7-Triangles | Chapter 15-Probability |
| Chapter 8- Quadrilateral |
NCERT Solutions of class 9 science
CBSE Class 9-Question paper of science 2020 with solutions
CBSE Class 9-Sample paper of science
CBSE Class 9-Unsolved question paper of science 2019
NCERT Solutions of class 10 maths
CBSE Class 10-Question paper of maths 2021 with solutions
CBSE Class 10-Half yearly question paper of maths 2020 with solutions
CBSE Class 10 -Question paper of maths 2020 with solutions
CBSE Class 10-Question paper of maths 2019 with solutions
NCERT solutions of class 10 science
Solutions of class 10 last years Science question papers
CBSE Class 10 – Question paper of science 2020 with solutions
CBSE class 10 -Latest sample paper of science
NCERT solutions of class 11 maths
| Chapter 1-Sets | Chapter 9-Sequences and Series |
| Chapter 2- Relations and functions | Chapter 10- Straight Lines |
| Chapter 3- Trigonometry | Chapter 11-Conic Sections |
| Chapter 4-Principle of mathematical induction | Chapter 12-Introduction to three Dimensional Geometry |
| Chapter 5-Complex numbers | Chapter 13- Limits and Derivatives |
| Chapter 6- Linear Inequalities | Chapter 14-Mathematical Reasoning |
| Chapter 7- Permutations and Combinations | Chapter 15- Statistics |
| Chapter 8- Binomial Theorem | Chapter 16- Probability |
CBSE Class 11-Question paper of maths 2015
CBSE Class 11 – Second unit test of maths 2021 with solutions
NCERT solutions of class 12 maths
| Chapter 1-Relations and Functions | Chapter 9-Differential Equations |
| Chapter 2-Inverse Trigonometric Functions | Chapter 10-Vector Algebra |
| Chapter 3-Matrices | Chapter 11 – Three Dimensional Geometry |
| Chapter 4-Determinants | Chapter 12-Linear Programming |
| Chapter 5- Continuity and Differentiability | Chapter 13-Probability |
| Chapter 6- Application of Derivation | CBSE Class 12- Question paper of maths 2021 with solutions |
| Chapter 7- Integrals | |
| Chapter 8-Application of Integrals |


